
In this article 7 sections
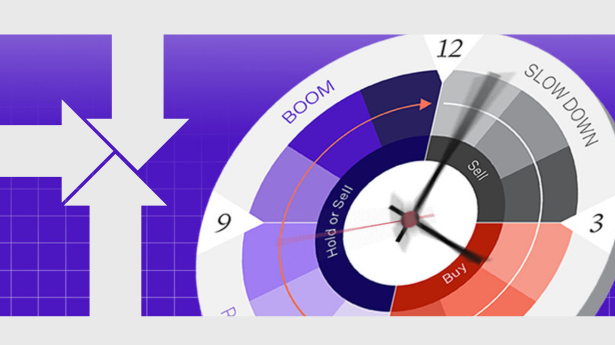
A property clock is a simple chart that shows where different property markets sit in their cycle, from the start of a recovery, through rising prices and a peak, to a decline and the bottom of the market. In Australia a widely used version is published by the valuation firm Herron Todd White (HTW) in its monthly Month in Review. It is the opinion of local valuers, not a forecast, so use it as one input alongside rents, supply and your own numbers.
What is the property clock?
The idea is that property markets tend to move through repeating stages. A clock face makes those stages easy to picture: a market moves round the dial from recovery, to rising, to peak, to decline, and back to the bottom. Each city or region can sit at a different point at the same time, which is why national averages can hide very different local markets.
Who publishes the property clock in Australia?
Herron Todd White publishes a Month in Review report covering residential, commercial and rural markets across Australia (HTW, Month in Review). The report includes Property Market Indicators tables for houses and units in each region. One row in those tables is the “Stage of Property Cycle”, and HTW also charts it, which is what most people call the property clock. People often search for it as the national property clock or the Australian property clock (HTW Month in Review, August 2026).
What are the stages of the property cycle?
HTW’s indicator tables use eight stages. In the order a market moves through them:
- Start of recovery: prices stop falling and buyers begin to return.
- Rising market: demand is stronger than supply and prices are lifting.
- Approaching peak of market: growth continues but is slowing.
- Peak of market: prices are at or near their high point for the cycle.
- Starting to decline: demand eases and prices begin to soften.
- Declining market: prices are falling.
- Approaching bottom of market: falls are slowing.
- Bottom of market: prices are at or near their low point.
The short descriptions after each stage are our plain English summary of what the stage names mean.
How do I read the property clock?
- Find your market. Look for the city or region you are interested in, and check whether you are reading the houses table or the units table, because they can sit at different stages.
- Read the other indicators too. HTW’s tables also show the rental vacancy situation and trend, demand, new construction and the volume of sales. A stage on its own tells you much less than the full row.
- Check the change from last month. HTW highlights entries that have changed position since the previous month, so check the legend in the current edition to see what each colour means.
- Use the latest edition. Positions change, so always check the current month rather than a screenshot shared online.
What are the limits of the property clock?
- It is the opinion of the valuers in each region, not a prediction of future prices.
- It covers broad cities and regions. A single suburb, street or property type can behave differently.
- Markets do not move round the clock at a set speed, and they can stall or move backwards.
- It is not a tool for timing the property market, because it describes current conditions rather than future prices.
- It does not know your budget, goal, borrowing capacity or time frame.
For an area you are serious about, check the official data as well: population change from ABS Data by region, rents from your state’s rental report, and the planning map for the street. Our where to buy research checklist walks through each step.
This is general information only, not financial advice, and it is not a forecast of where any market is heading.
How does Citadel Agency use market cycle data?
Cycle indicators are one of many inputs our research team checks, alongside rents, vacancy, supply, infrastructure and the numbers for each property. Citadel Agency is a licensed buyers agency (licence 092247L) with $165M+ in deals transacted. See our results, try the property growth calculator, or book a call.
Questions, answered
What is the property clock in Australia?
It is a chart showing where property markets sit in their cycle. A widely used version comes from Herron Todd White’s monthly Month in Review, where local valuers rate each region from start of recovery through to bottom of market.
Who makes the Herron Todd White property clock?
Herron Todd White, a property valuation and advisory firm, publishes it in its Month in Review report as the “Stage of Property Cycle” indicator for each region.
How many stages are in the property cycle?
HTW uses eight: start of recovery, rising market, approaching peak of market, peak of market, starting to decline, declining market, approaching bottom of market and bottom of market.
Can the property clock predict prices?
No. It reflects valuers’ views of current conditions. Markets can stall or change direction, so use it with rents, supply data and your own numbers.
How often is the property clock updated?
HTW publishes its Month in Review each month, so check the latest edition rather than an older copy.
General information only. It does not take your objectives, financial situation or needs into account and is not financial, tax, credit or legal advice.