

When comparing investment properties, it is easy to become attached to the property that looks the best, has the nicest renovation, or feels like the best opportunity. But an investment property is not being purchased simply as a home. It is an asset that needs to perform against a set of financial and market objectives.
A data-driven comparison helps investors separate what they like from what the numbers actually support. Instead of asking which property is the better choice, investors can compare each property using the same measures to identify which one offers the strongest overall investment case.
The aim is not to find the property with the largest number in a given category. A high rental yield, for example, does not automatically mean better investment performance. The stronger approach is to assess several indicators together.
Compare the Location Using Measurable Indicators
The first step is to compare the markets in which the properties are located. Location data can reveal whether an area has the fundamentals to support long-term housing demand.
Population growth, employment, infrastructure investment, rental demand, vacancy rates, historical price performance, and new housing supply can all provide useful evidence. Investors should look for locations where several of these indicators are moving in a supportive direction rather than relying on one impressive statistic.
Price is also important, but it should not be treated as a measure of quality by itself. The latest ABS data shows how significantly mean dwelling prices vary across Australia. In the June quarter of 2026, the mean dwelling price was $1.305 million in NSW compared with $614,400 in the Northern Territory. Queensland and Western Australia were also above $1.1 million.
Mean Dwelling Prices Across Australia
Mean residential dwelling prices by state and territory in the June quarter of 2026.
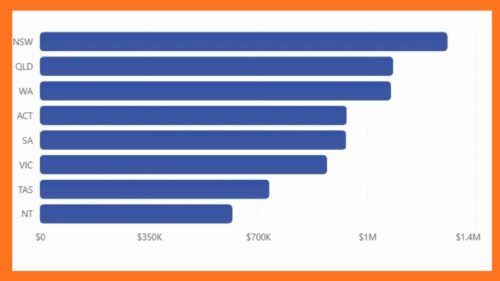
The comparison demonstrates why price alone cannot determine which property is the better investment. A cheaper property may offer affordability, but investors still need to determine whether the local market has sufficient rental demand, economic drivers and future growth potential.
The same principle should be applied at suburb level. Two properties with similar purchase prices can have very different investment prospects if one is located near major employment and infrastructure while the other has weaker underlying demand.
Compare the Financial Performance
Once the locations have been assessed, compare the financial performance of each property using the same assumptions. This should include the purchase price, expected rent, gross rental yield, loan costs, ongoing expenses and estimated cash flow.
Gross rental yield can be calculated using annual rental income divided by the property’s purchase price. However, investors should go further than the headline yield. Property management fees, insurance, council rates, maintenance, land tax where applicable, body corporate costs and vacancy periods can materially change the actual cash position.
It is also important to use realistic rental estimates rather than the highest advertised rent in the suburb. Compare several similar properties and consider whether the property itself has the features required to achieve that rent.
When comparing two properties, consistency is critical. If one property’s financial model assumes full occupancy while another includes a vacancy allowance, the comparison will not be meaningful.
Compare Growth Potential and Future Demand
Historical price growth can provide useful context, but it should not be used as a prediction of future performance. Instead, investors should investigate the factors that may influence future demand.
Population growth, employment opportunities, infrastructure, transport, education, healthcare and local economic activity can help explain why buyers and tenants are attracted to a particular market. The quality and scarcity of the property itself should also be considered.
Future housing supply is another important comparison point. ABS data shows that 16,953 dwellings were approved across Australia in August 2026, with total approvals 10.3% higher than a year earlier. However, the pattern differs between states and between houses and other dwelling types.
This matters because a suburb experiencing significant new development may have more competition for tenants and future buyers. Comparing the amount and type of housing likely to enter a market can therefore provide useful information that a simple historical growth figure cannot.
Compare the Properties, Not Just the Suburbs
Even when two properties are in the same suburb, they should not automatically be treated as equivalent investments. The individual property can have a significant impact on rental demand, maintenance costs, resale appeal and future value.
Compare factors such as land size, floor plan, bedrooms, parking, outdoor space, property condition, renovation requirements and proximity to amenities. An investor should also consider whether the property appeals to a broad tenant market rather than a very specific type of renter.
Property-specific risks should be included in the comparison. Building issues, flood or bushfire exposure, strata costs, easements, planning restrictions and significant upcoming maintenance can change the investment equation considerably.
This is where data and due diligence work together. A property with slightly lower projected returns may ultimately be the stronger investment if it has fewer structural risks, lower ongoing costs and broader buyer and tenant appeal.
Build a Simple Investment Comparison Scorecard
After collecting the data, bring everything together into a consistent comparison. Instead of allowing one impressive number to dominate the decision, assess each property across several categories.
A simple scorecard might compare purchase price, rental yield, cash flow, rental demand, historical growth, population growth, employment drivers, infrastructure, supply, property condition and resale appeal.
The weighting of each category should reflect the investor’s strategy. An investor focused on long-term capital growth may place greater importance on location fundamentals, population, employment and supply. Another investor prioritising income may place greater weight on rental demand and cash flow.
The important point is that the same criteria should be applied to every property being considered. This creates a more objective comparison and makes it easier to identify where one property genuinely has an advantage.
Conclusion
Comparing investment properties using data does not mean ignoring your instincts completely. It means making sure emotion does not become the primary reason for purchasing an asset.
The strongest comparison considers the location, financial performance, future demand, property-specific risks and long-term investment potential together. When every property is assessed using the same criteria, investors can see the strengths and weaknesses more clearly.
A property does not need to win every category to be a good investment. What matters is whether its overall fundamentals align with the investor’s strategy, financial position and long-term objectives.
The best property is not necessarily the one you like most. It is the one whose data supports the investment case.
Ready to Compare Your Next Investment Property?
Choosing between investment properties is easier when the decision is supported by reliable research and a clear investment framework.
Citadel Agency takes a research-led approach to property investment, helping investors assess markets and properties based on data, fundamentals and long-term potential.
Speak with our team to explore your next investment opportunity.