How to Read a Property Clock is a practical way to understand where a market sits in the cycle so you can decide whether to buy, hold or exercise caution. The property clock groups market movements into repeatable stages that typically run from early recovery to rising to peak then easing to bottom. In this guide you will learn the stages, see where Australia sits now, and get a simple checklist to turn signals into action. We include references to respected sources and keep everything general in nature in line with Australian guidance on general advice.
Property cycle stages in Australia explained
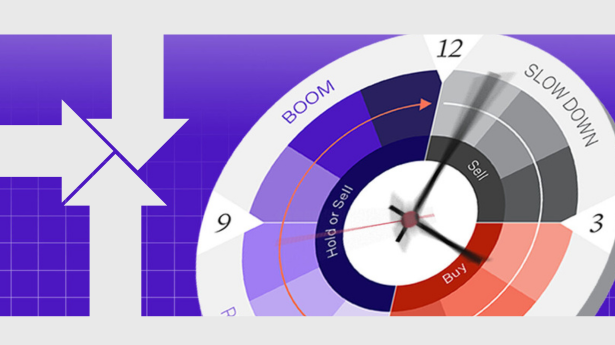
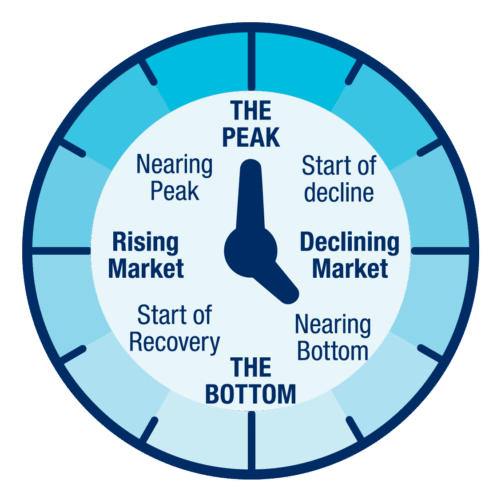
Think of the clock face as a simple map of price momentum. Twelve to three is early recovery. Three to six is a rising market. Six is peak. Six to nine is easing or decline. Nine to twelve is bottoming and the start of recovery. The power of the model is its clarity. Herron Todd White popularised a monthly National Property Clock that places cities and regions at points along this cycle for houses and units. Use it as a clean snapshot not as a prediction. Local markets move at different speeds because supply demand and credit settings differ by city and even by suburb.
Where the market sits now using current data
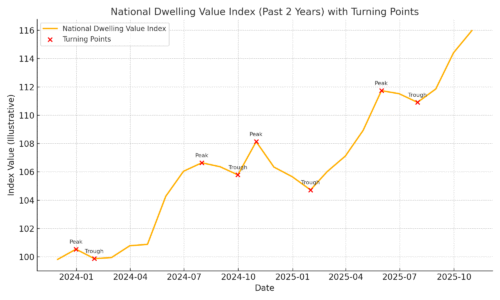
Before you choose buy, hold, or caution, anchor your view in current data. Recent figures show national dwelling values rose 1.1% in October with annual growth of 6.1%. Gains were broad across capitals and regions which is a useful cross check when a clock shows many markets in a rising phase. Perth and Brisbane showed some of the strongest monthly lifts with a one point nine percent and one point eight percent rise. This context matters because momentum near three to six on the clock can support hold for owners and selective buy for investors who find value in submarkets.
The Reserve Bank household sector chart pack is a reliable place to view price and credit trends along with approvals and debt ratios. Combine that macro lens with local indicators such as listings levels and auction clearance rates. In short, start with national momentum then zoom into your city and suburb.
Turning the clock into buy hold and caution rules
Here is a simple way to convert stages into steps:
Buy signals
- Listings are tight for your target suburbs while days on market are stabilising or falling
- Price momentum has turned positive in your segment for at least three consecutive months
- Rental vacancy is low and yields are trending steady or higher
These align with the start of recovery to rising stages where value can still be found before heat builds
Hold signals
- Prices are rising across the middle of the market and clearance rates sit near decade averages or better
- Your property level value drivers are still improving and rental demand remains healthy
This aligns with three to five on the clock where compounding gains are more likely than sharp value jumps.
Caution signals
- Growth is slowing from peak levels and supply is building
- Credit settings are tightening or serviceability is compressing
- Yields are compressing faster than rents are rising
This aligns with late rising to peak stages where patience and risk control matter more than speed.
Common mistakes and quick answers
Is the property clock a forecast?
No. It is a snapshot of relative position. Treat it as a guide not a guarantee. Cross check with hard data.
Does every market move together?
No. National and city trends can diverge. The Herron Todd White reports regularly show different capitals at different points in the cycle within the same month.
Can the clock be wrong?
Any model can be wrong when shocks hit credit policy migration or supply. Use it with a risk plan and conservative buffers. For general consumer guidance on risks and cautions see MoneySmart resources.
What about compliance and advice?
This article provides general information only. It is not personal advice. For Australian rules on general advice warnings and what counts as personal advice refer to ASIC guidance.
A property clock gives you a clear frame to think in buy, hold, and caution. Pair it with current data and suburb level signals and you can act with more confidence and less guesswork. If you would like a suburb shortlist or a property clock checklist tailored to your goals book a free strategy call today and we will map your next steps with clear numbers.